Basic Analysis: Single Country Example
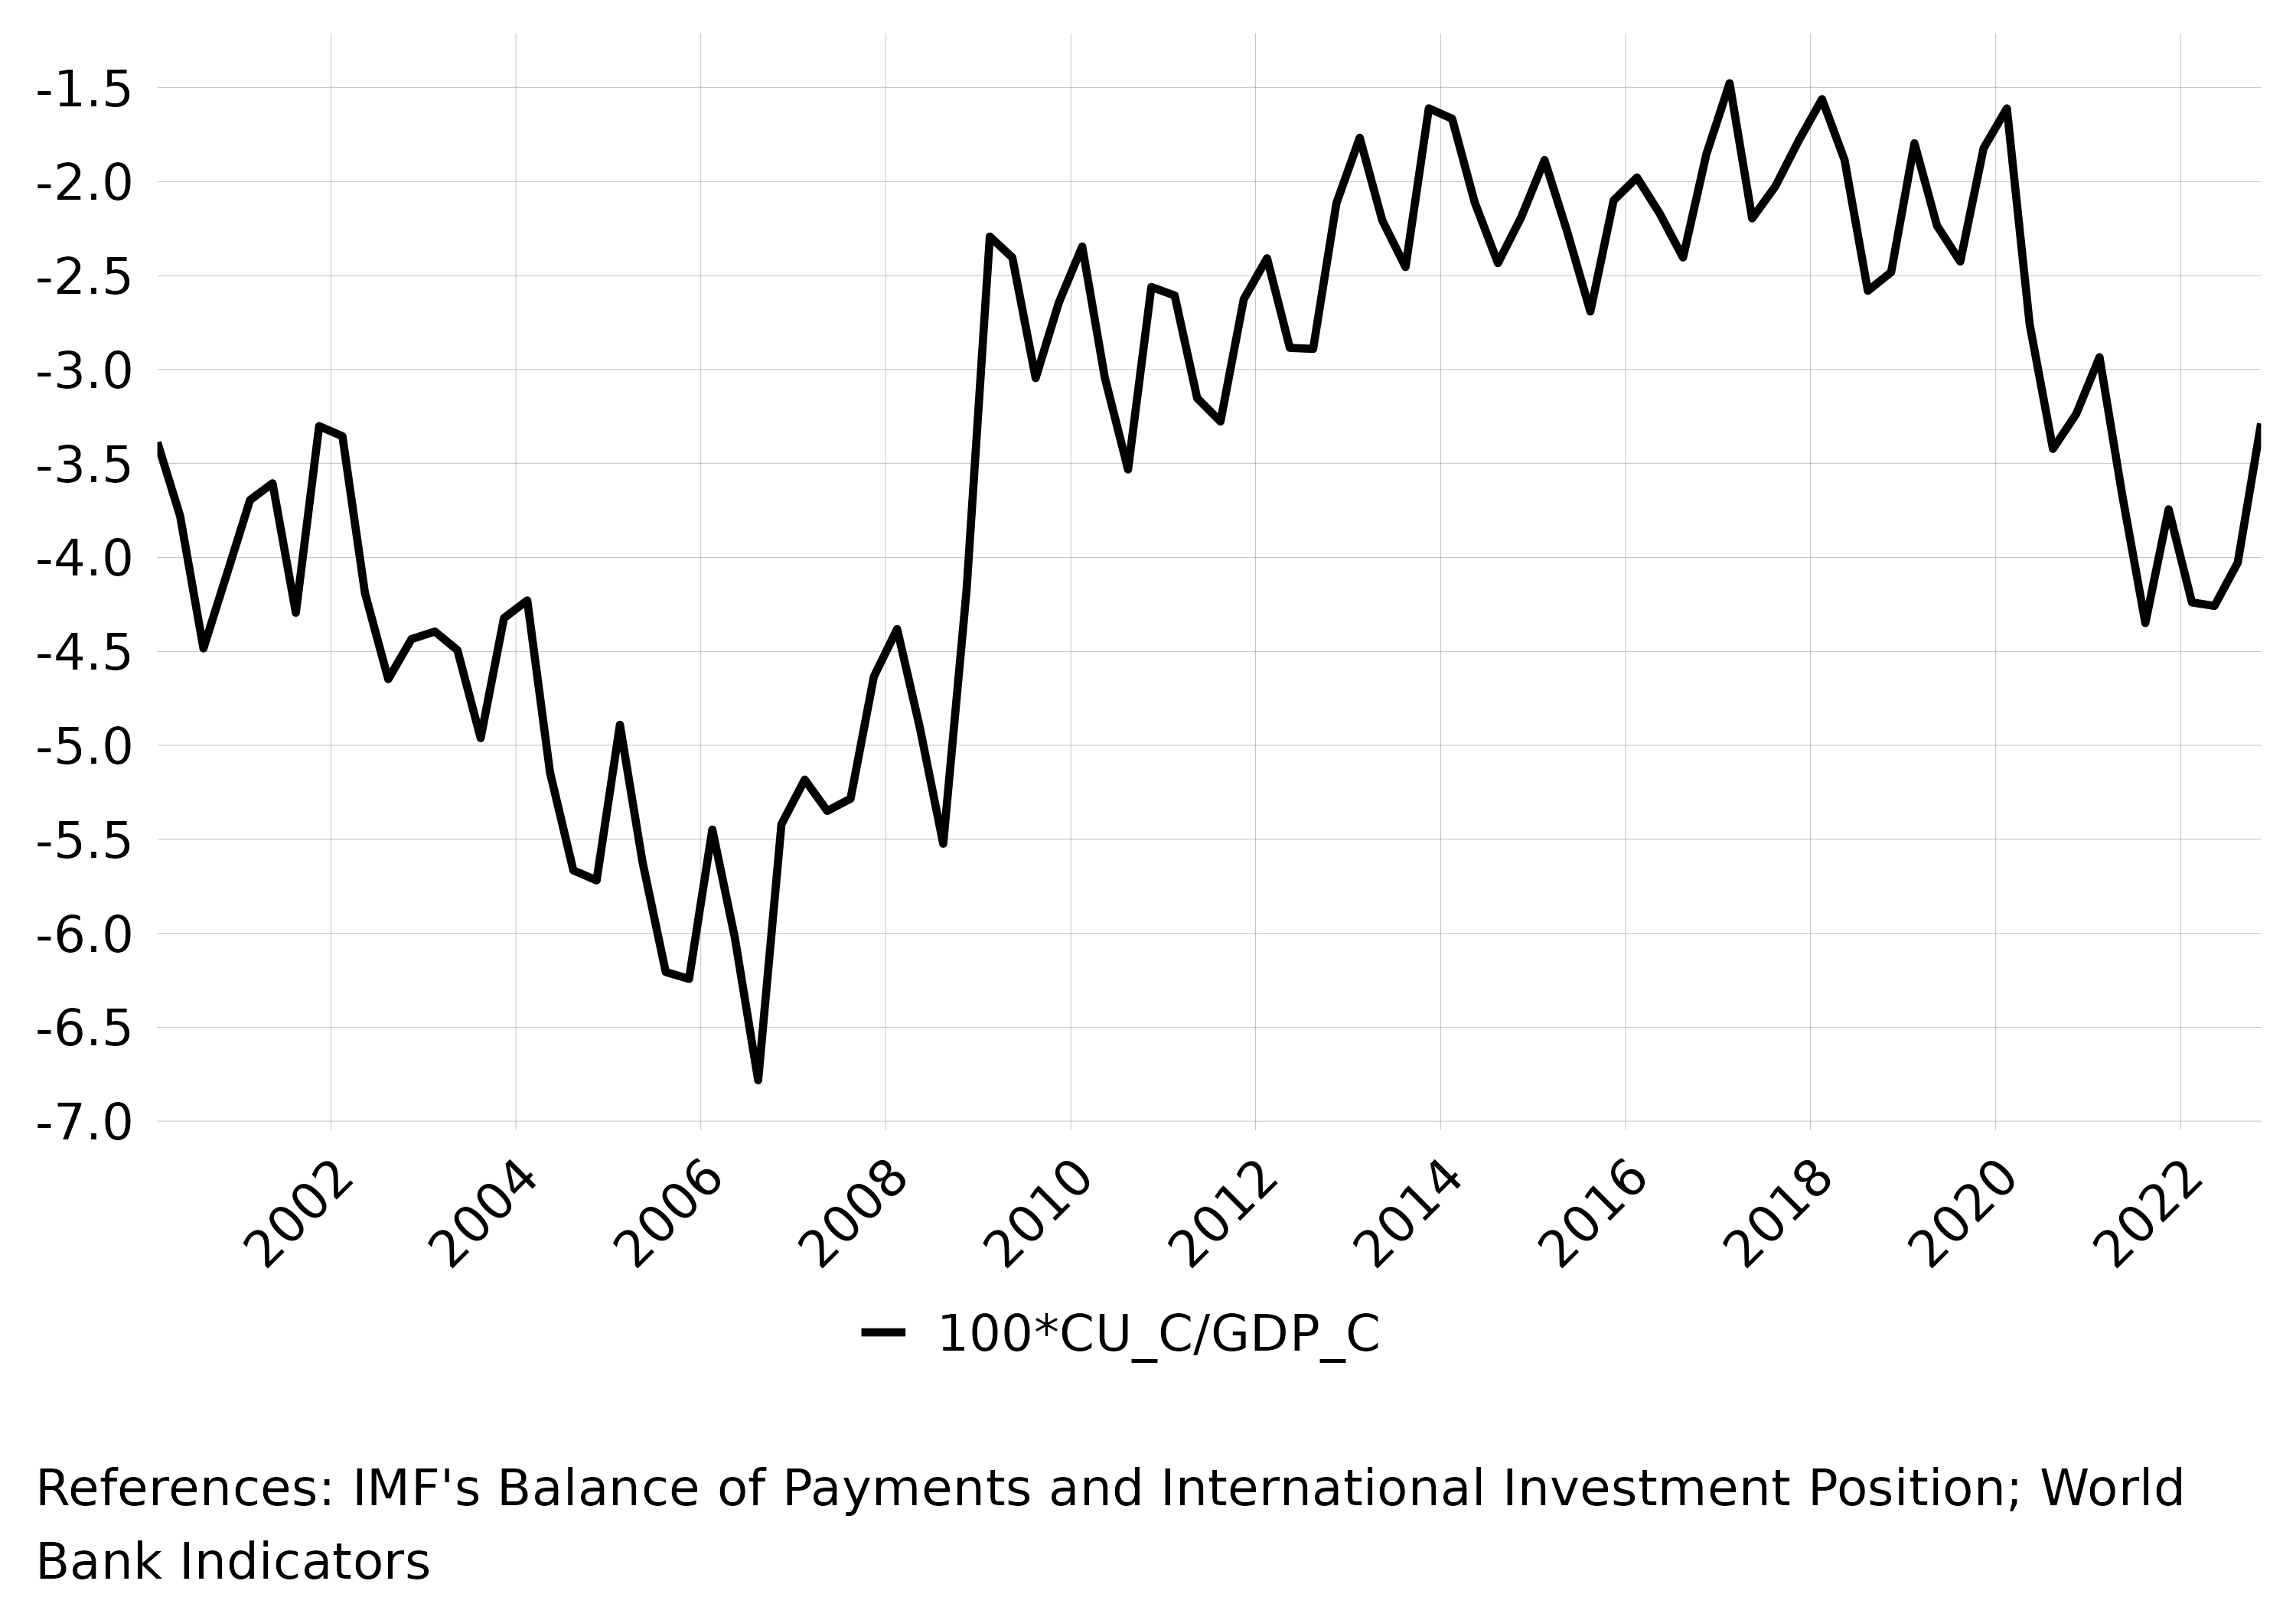
To analyze a country’s economic indicators, start with a simple example. Here’s how to calculate the US current account as a percentage of GDP:
This returns a data frame with the results:
head(basic_code)## ISO Variable Date Value
## 1 USA 100*CU_C/GDP_C 2000Q1 -3.387035
## 2 USA 100*CU_C/GDP_C 2000Q2 -3.779831
## 3 USA 100*CU_C/GDP_C 2000Q3 -4.484382
## 4 USA 100*CU_C/GDP_C 2000Q4 -4.091121
## 5 USA 100*CU_C/GDP_C 2001Q1 -3.694783
## 6 USA 100*CU_C/GDP_C 2001Q2 -3.605399
## Reference
## 1 IMF's Balance of Payments and International Investment Position; World Bank Indicators
## 2 IMF's Balance of Payments and International Investment Position; World Bank Indicators
## 3 IMF's Balance of Payments and International Investment Position; World Bank Indicators
## 4 IMF's Balance of Payments and International Investment Position; World Bank Indicators
## 5 IMF's Balance of Payments and International Investment Position; World Bank Indicators
## 6 IMF's Balance of Payments and International Investment Position; World Bank IndicatorsWe can visualize this data using wp_plot_series():
wp_plot_series(basic_example)
Basic Time Series Plot
Advanced Analysis: Multiple Countries
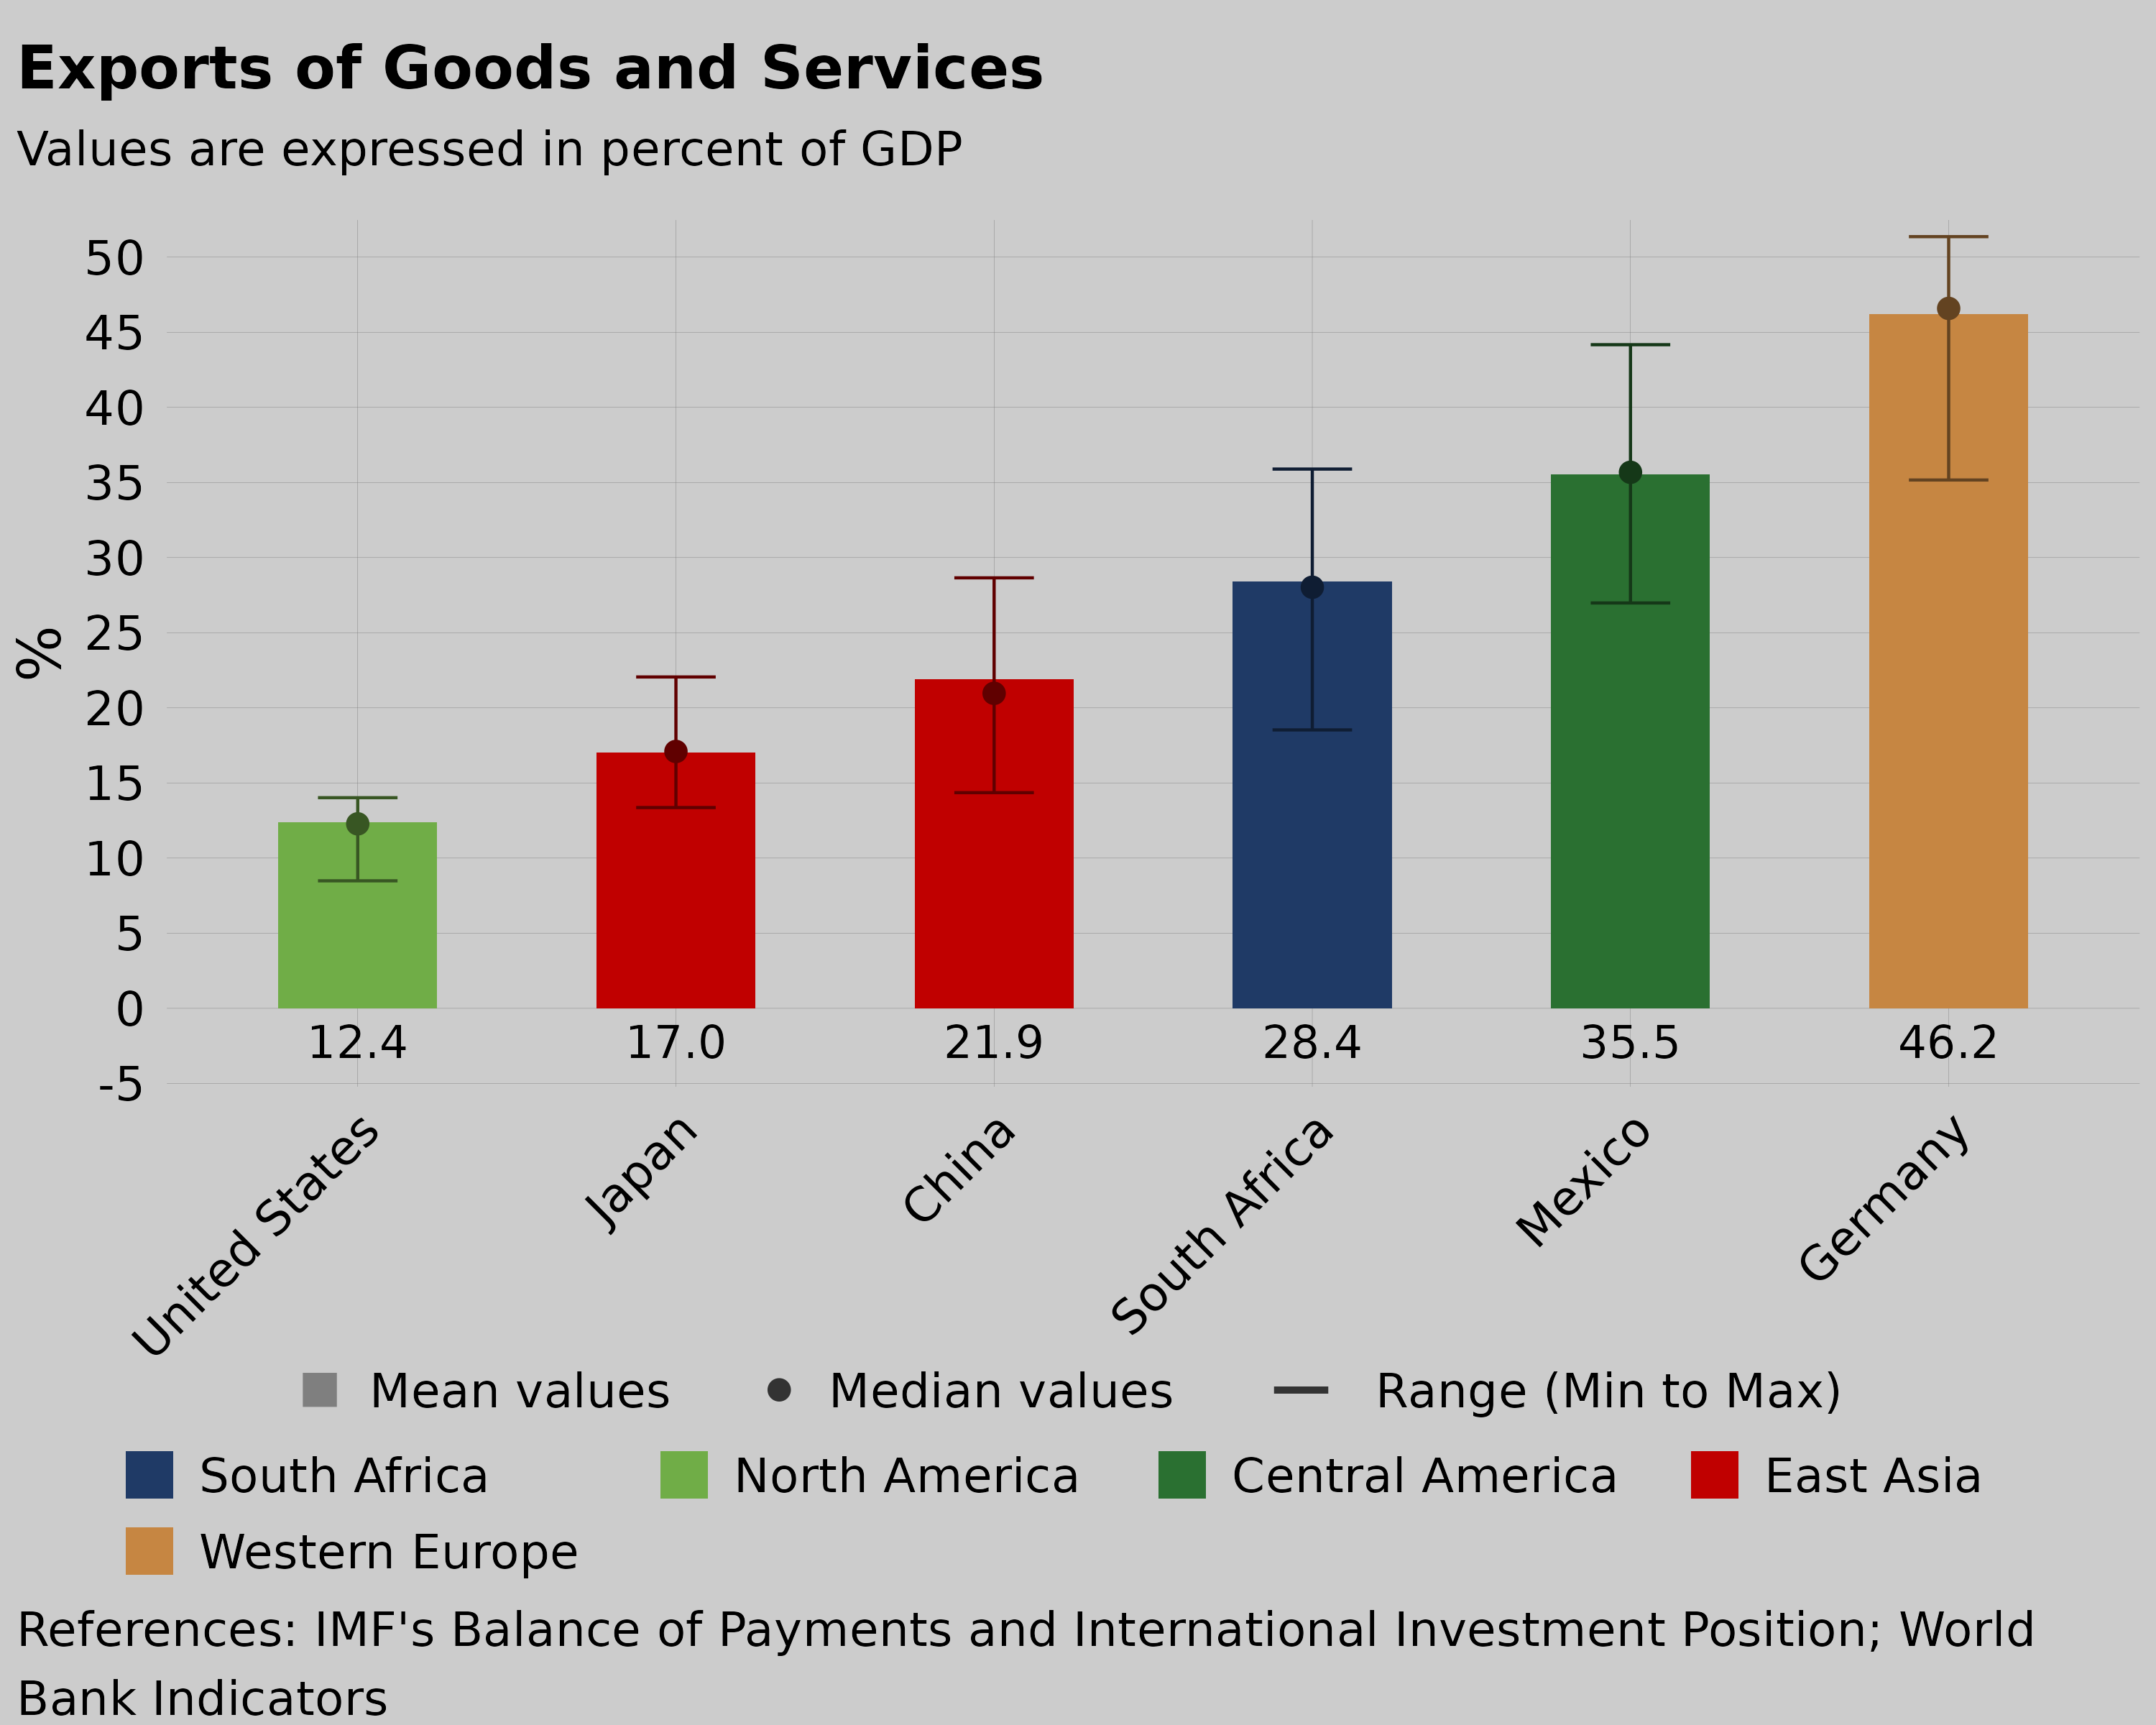
For comparative analysis, we can examine multiple countries. Let’s look at export ratios for China and Japan:
advanced_example <- wp_data(
  ISO = c("CHN", "JPN", "USA", "DEU", "ZAF", "MEX"),
  formula = c("100*(EXg_C+EXs_C)/GDP_C"),
  variable = "Exports (% of GDP)",
  years = c(2010, 2022)
)
Here’s the resulting data:
head(advanced_code)## ISO Variable Date Value
## 1 CHN Exports (% of GDP) 2010Q1 23.50121
## 2 CHN Exports (% of GDP) 2010Q2 26.90153
## 3 CHN Exports (% of GDP) 2010Q3 28.65422
## 4 CHN Exports (% of GDP) 2010Q4 27.94295
## 5 CHN Exports (% of GDP) 2011Q1 24.93694
## 6 CHN Exports (% of GDP) 2011Q2 26.94874
## Reference
## 1 World Bank Indicators; IMF's Balance of Payments and International Investment Position
## 2 World Bank Indicators; IMF's Balance of Payments and International Investment Position
## 3 World Bank Indicators; IMF's Balance of Payments and International Investment Position
## 4 World Bank Indicators; IMF's Balance of Payments and International Investment Position
## 5 World Bank Indicators; IMF's Balance of Payments and International Investment Position
## 6 World Bank Indicators; IMF's Balance of Payments and International Investment PositionWe can create a bar plot to compare these values:
wp_plot_bar(advanced_example,
            title = "Exports of Goods and Services",
            subtitle = "Values are expressed in percent of GDP",
            y_axis = "%",
            color = "Subregion",
            bg = "#CCCCCC")
Advanced Bar Plot